Big Data Visualization with Meaning
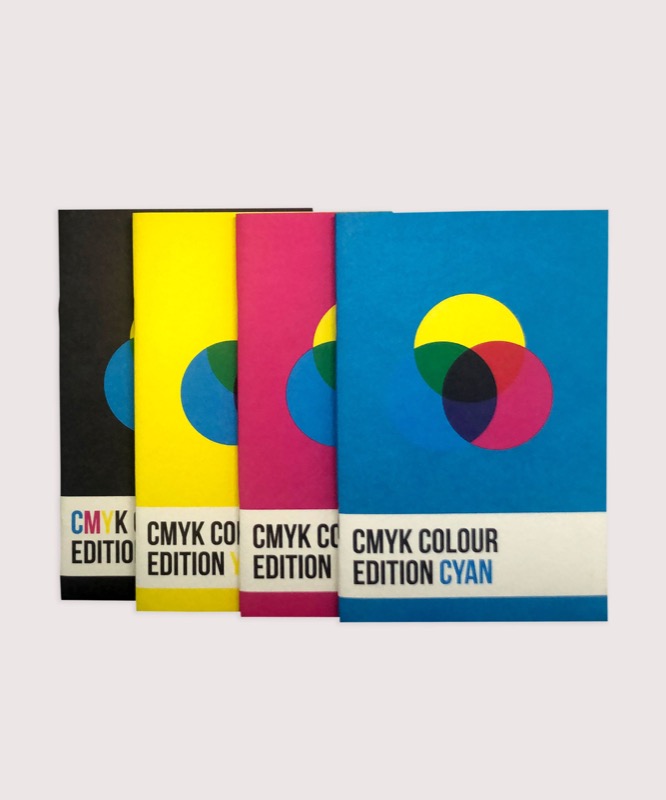 A notebook you'll actually carry every day.
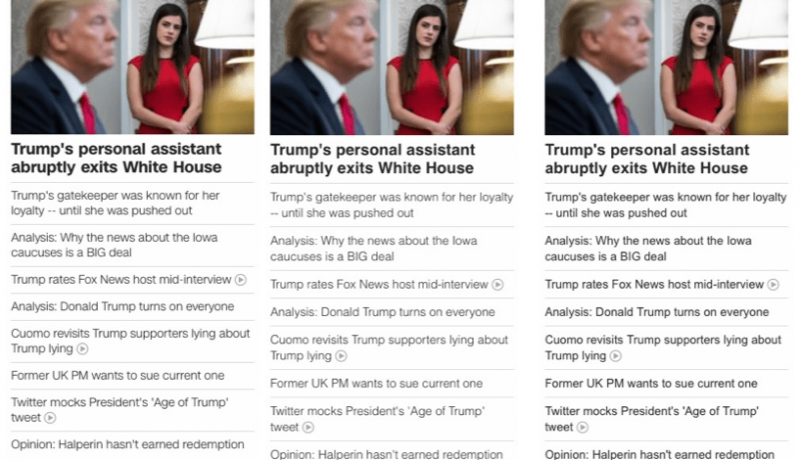
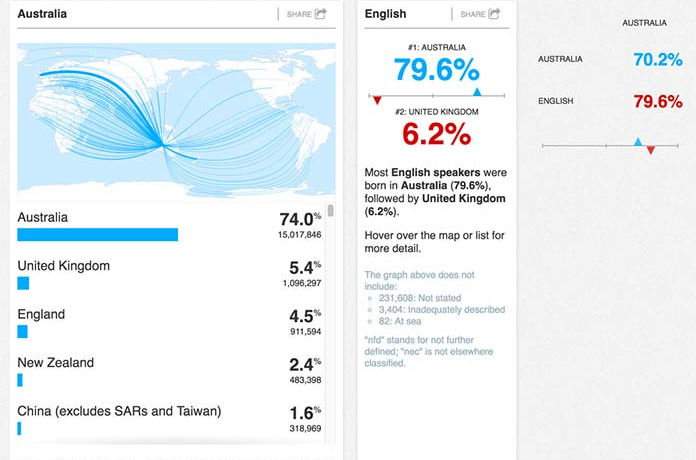
Some wonderful visualisation examples in this article. The most difficult thing is to keep the visualisations accessible across many viewports, and ensuring that you can tell the same story with more/less screen space
The web is not the traditional home of data visualization. You might come across a bar chart here or there in your online journey on any given day, but they’ve never been an artifact of web history. It seems like that’s been changing.
An excerpt from Big Data Visualization with Meaning